Traffic Stream: Waiting Times
Description
For a semester project, in a group of 2 we implemented an interactive prototype with React, TypeScript, deck.gl and mapbox to visualize traffic data on a map. The app comprises an overview and detail view to visualize waiting times and routes of cyclists at street crossings. We came up with a design concept to improve the User Experience and create a clearly arranged User Interface which we presented and discussed in regular meetings with the product owners.
Year
2020
Contribution
Equal distribution of tasks
Context
Group project for course Mobile and Ubiquituous Computing; group of 2
Skills
React, TypeScript, Docker, deck.gl, mapbox, node.js, express, UX Design, UI Design, Data Visualization, Figma
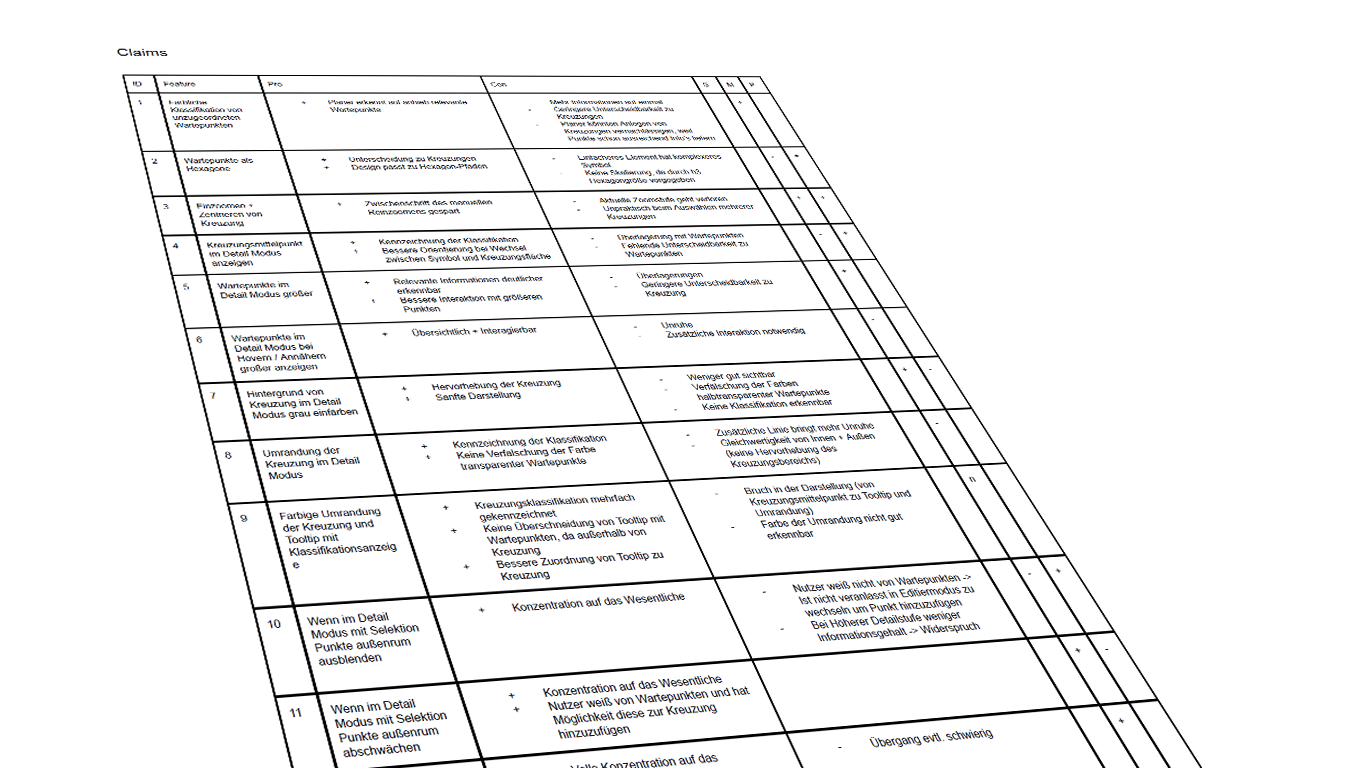
Claims Analysis
We did a claims analysis as basis for design decisions.
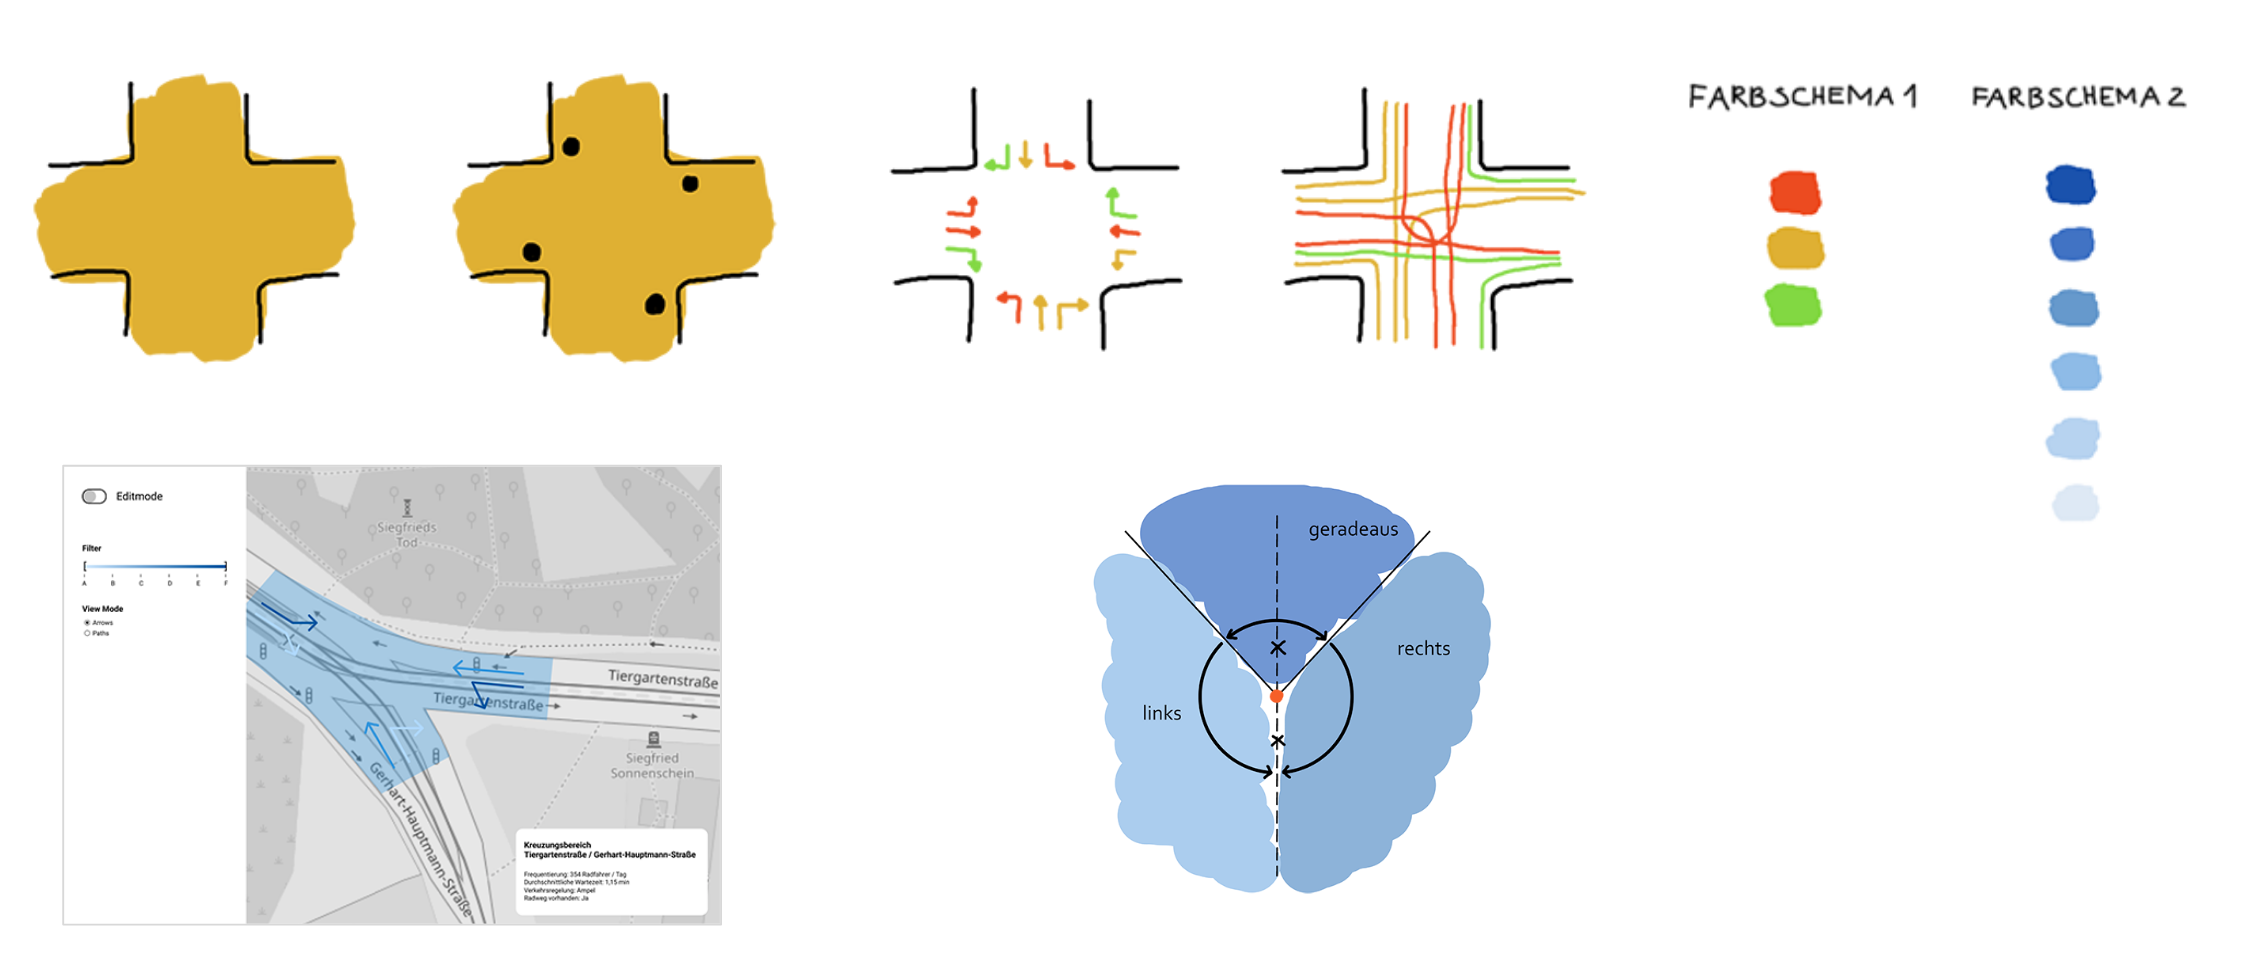
Visual Design
We used Figma to create a visual design concept.
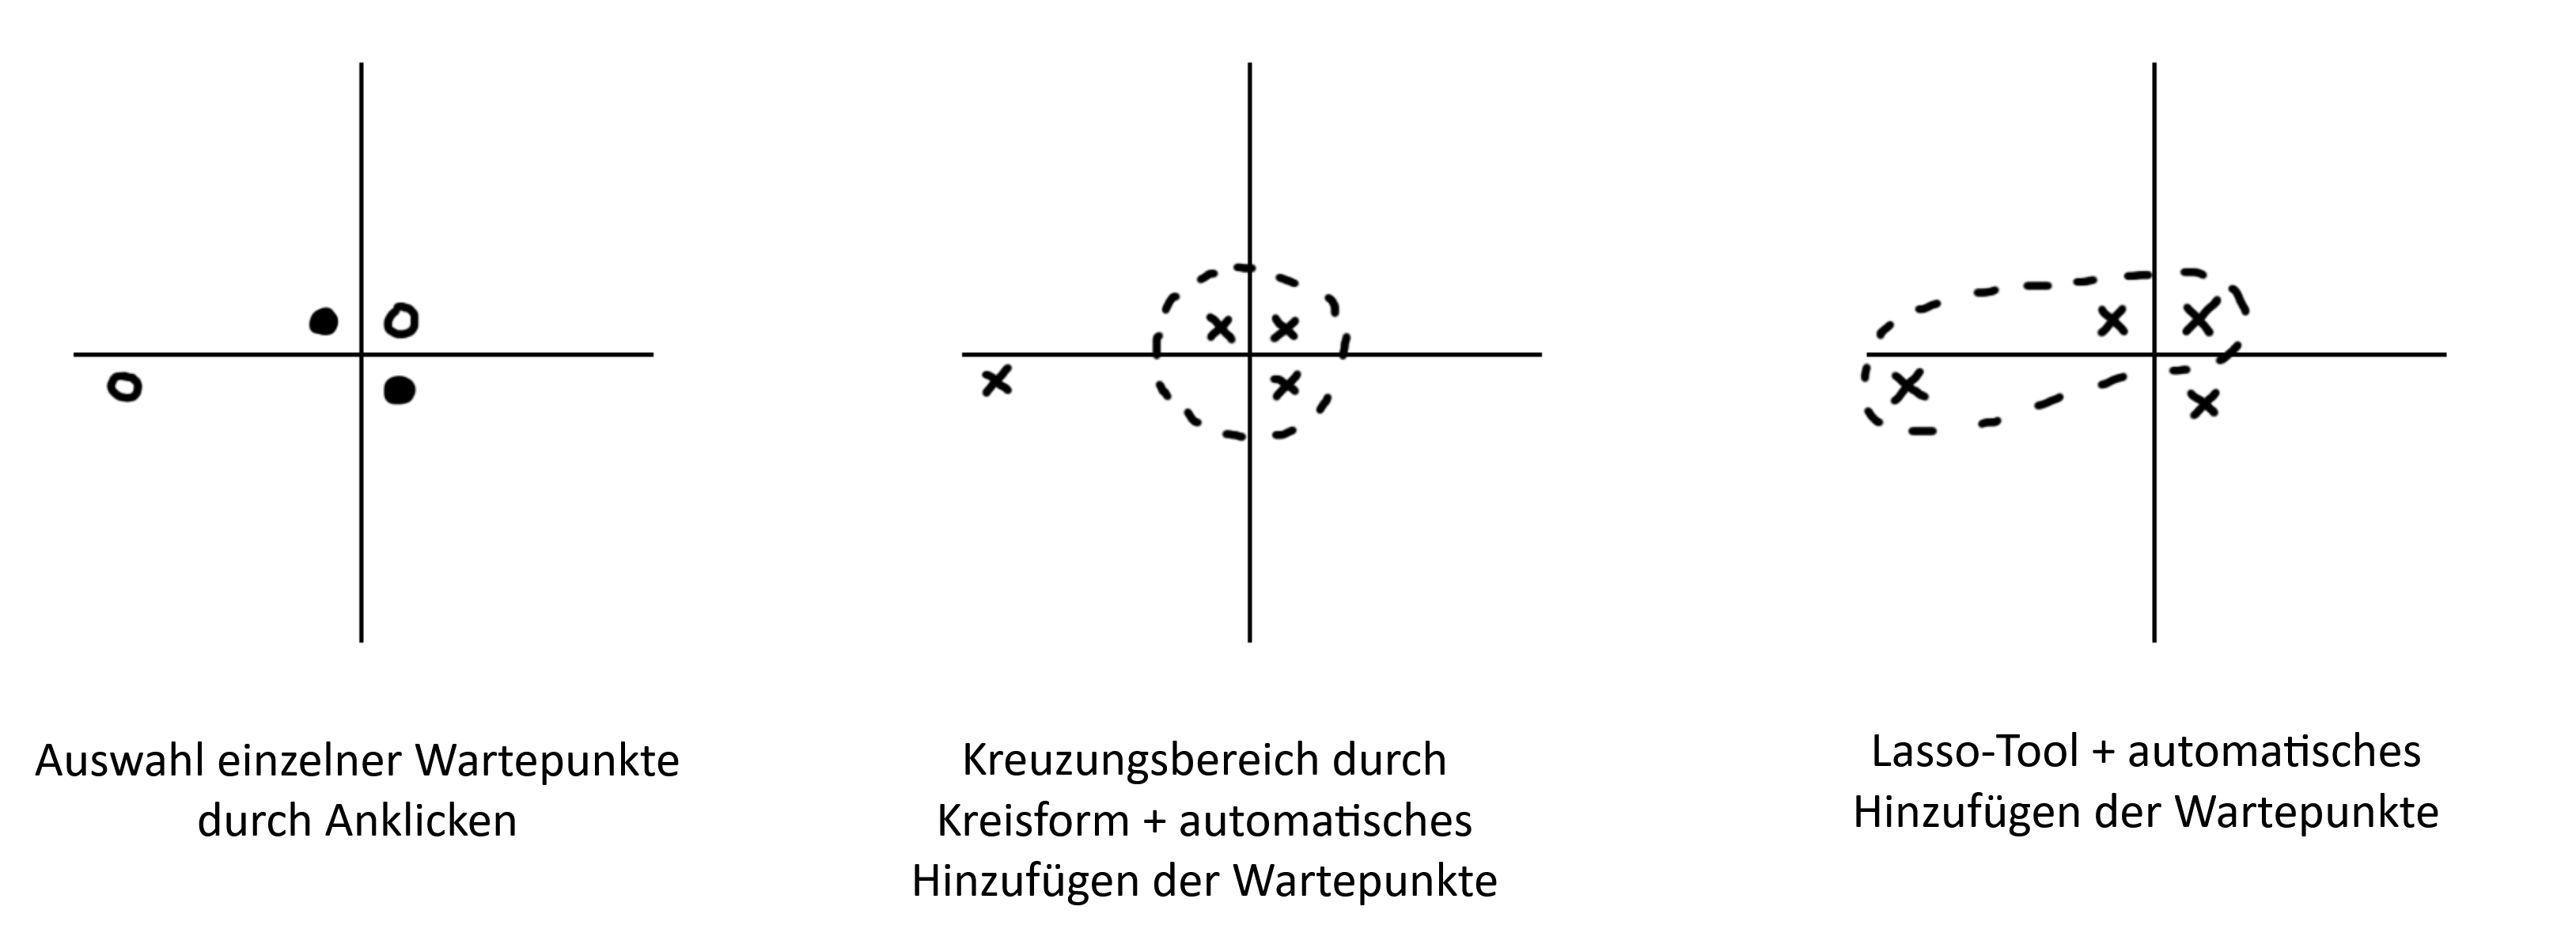
Interaction Design
We aimed for an intuitive interaction to select multiple waiting points and group them to a street crossing. We evaluated different approaches towards usability, intuitiveness and implementation.
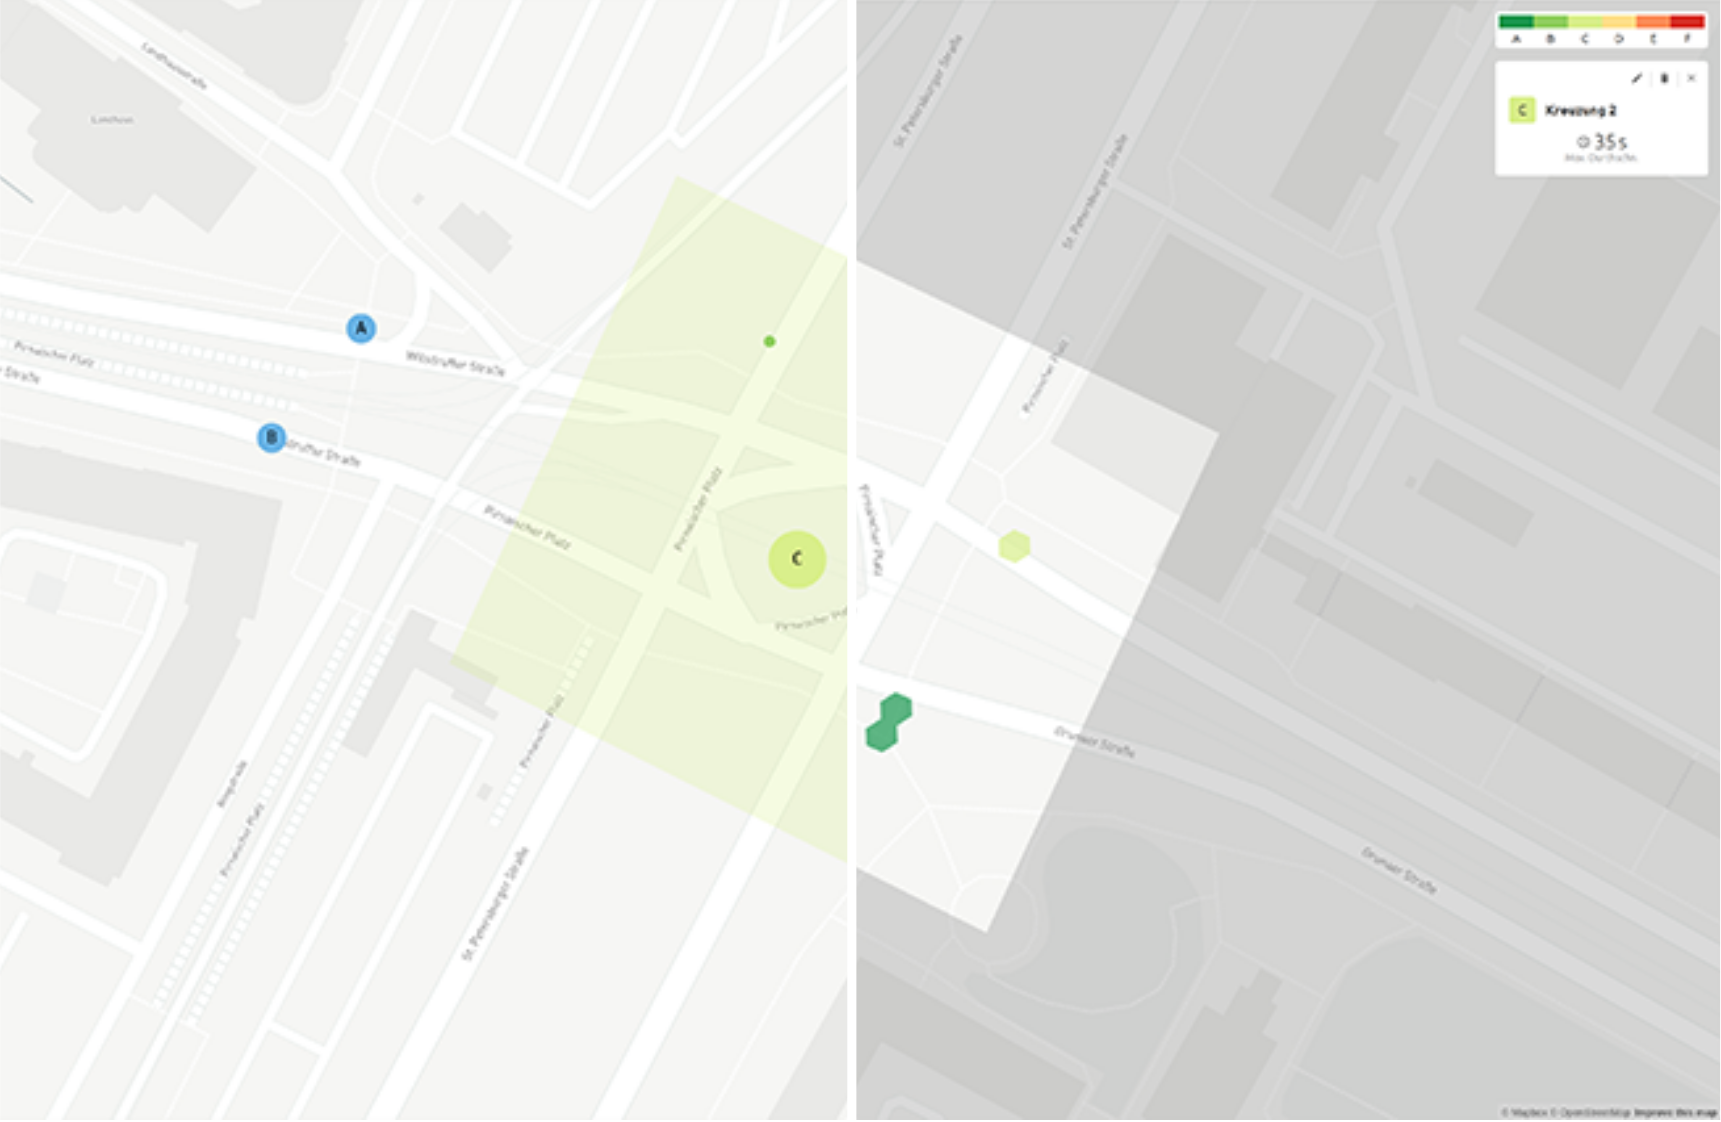
Overview, Zoom and Filter, Details on Demand
We followed Shneiderman's visualization mantra "Overview first, zoom and filter, details on demand".